BOM Cost Share Distribution Report
One of the new reports in Microsoft Dynamics NAV 2013 is the BOM Cost Share Distribution Report that came with the assembly functionality. It is a great looking report, and what makes it even better is that it does not only work with assembled items but also with manufactured items.
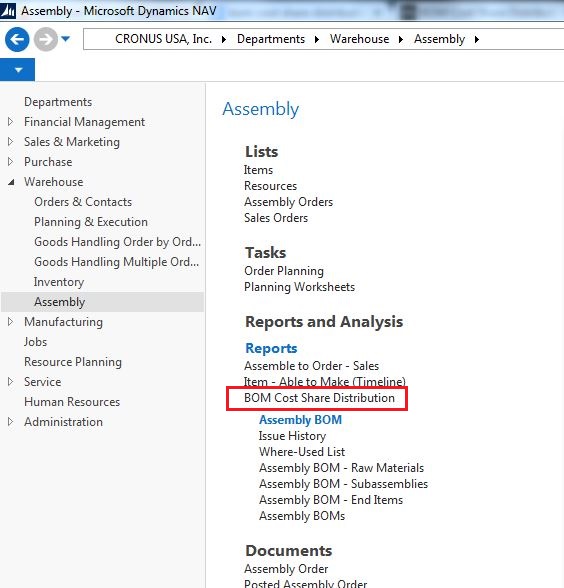
You find the report in the assembly part of Dynamics NAV (I think it should have been added to the manufacturing part as well since it is such as nice report).
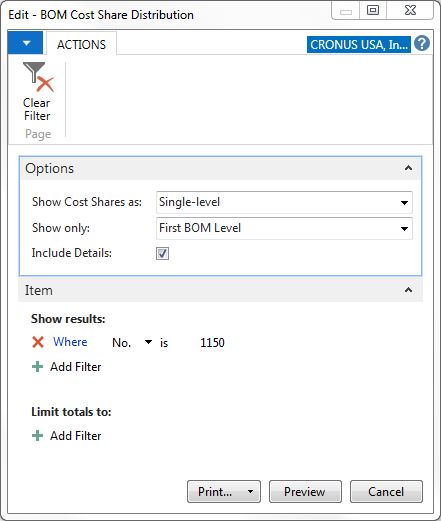
When you run it you get a request page where you can set if you want to view the single-level or rolled-up costs. The rolled-up costs I think is most interesting since it gives you the total capacity cost for all BOM levels of the components that make up the item. The report also gives you the option to show only the fist BOM level or all the levels.
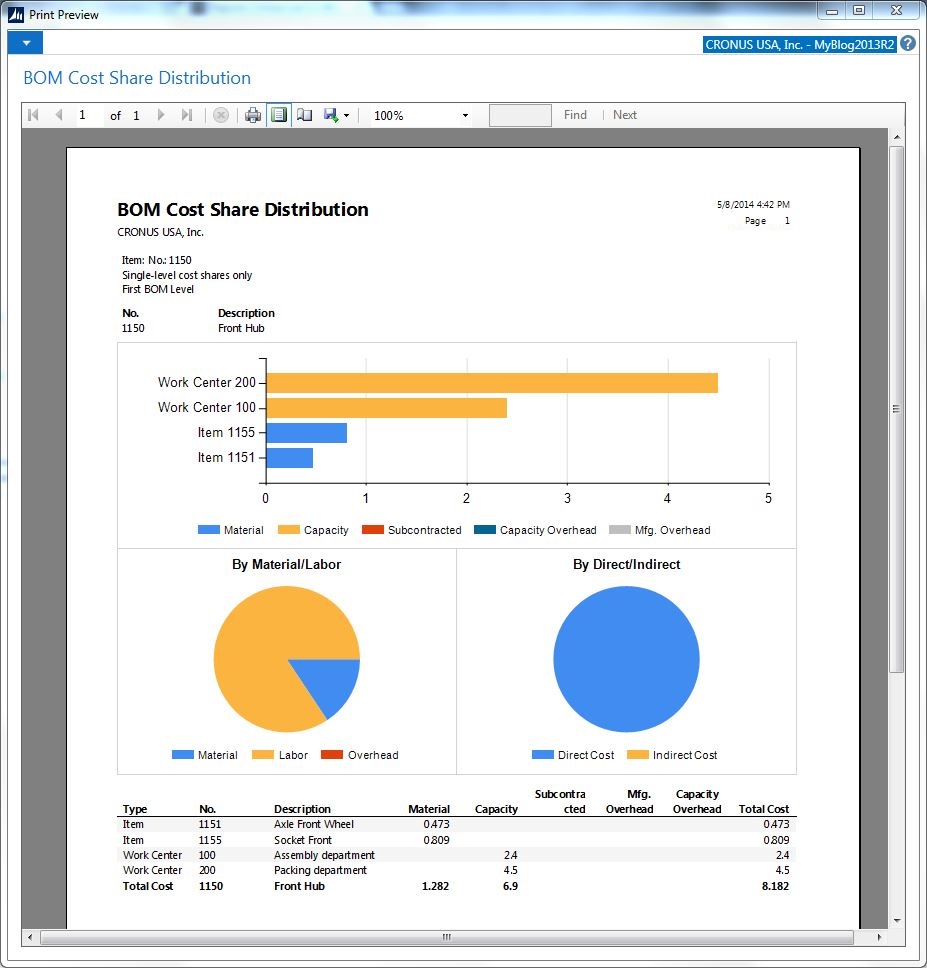
When you print/preview the report you get a page per each produced or assembled item. Each page has charts that represents the different costs, there is a bar chart that shows the costs per component items and work centers (if you have multiple operations on the same work center on a routing it will combine them). There are also pie charts displaying the material/labor and the direct/indirect costs. In addition to the breakdown in a table. Nice! 🙂
This report is something that all pre-sales Dynamics NAV professionals should have as part of a manufacturing demo, suddenly Dynamics NAV have great looking reports as well!
I wish all reports in Dynamics NAV was this nice, maybe something for Dynamics NAV 2015?


