Custom Business Chart Add-In Example for NAV 2013 R2
Here is an example of how to create a custom chart in Microsoft Dynamics NAV 2013 R2 using the business chart control add-in that is provided by the Microsoft.Dynamics.Nav.Client.BusinessChart.dll assembly. It sounds complicated, but it is actually quite easy.
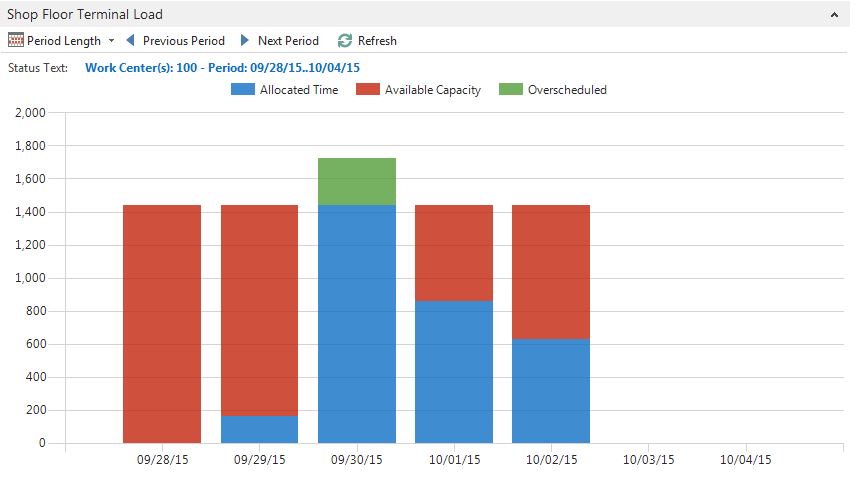
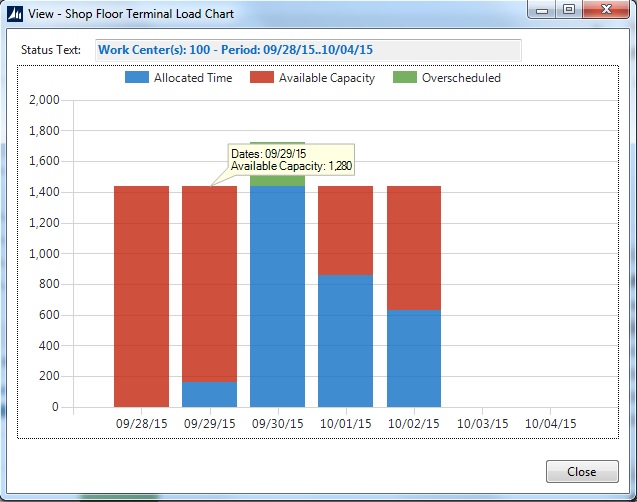
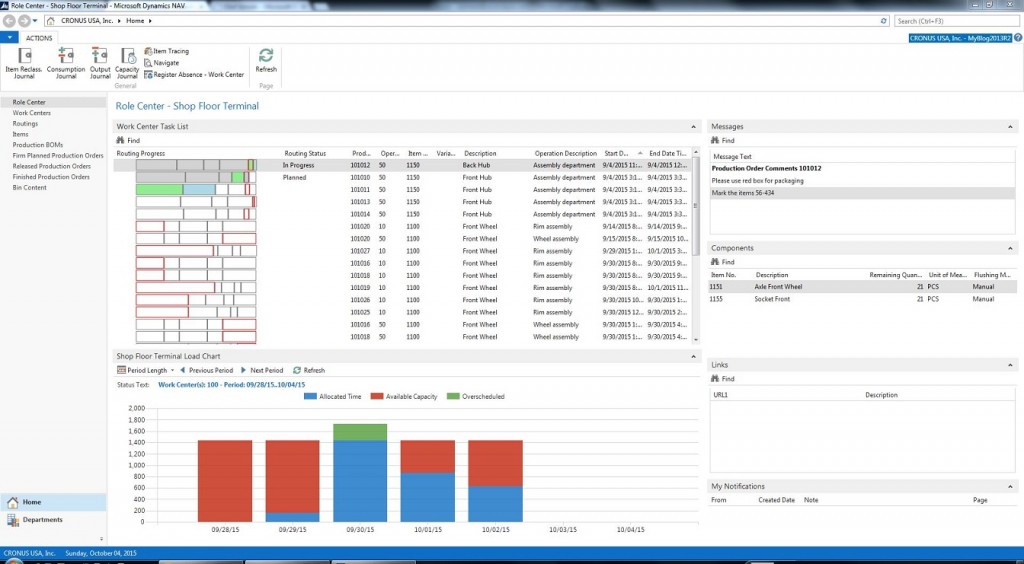
The example shows how to create a work center load chart that shows available vs. allocated capacity on a day by day basis. If you have read some of my previous blog posts (the Custom Progress Bar or Interaction Between Role Center Parts) you know that I am working on a shop floor terminal role center (more for my own training) that this custom chart will be part of. The idea is to provide a graphical representation like the below for the machine operator to see how much work that has been allocated to the work center(s) that he/she is running.
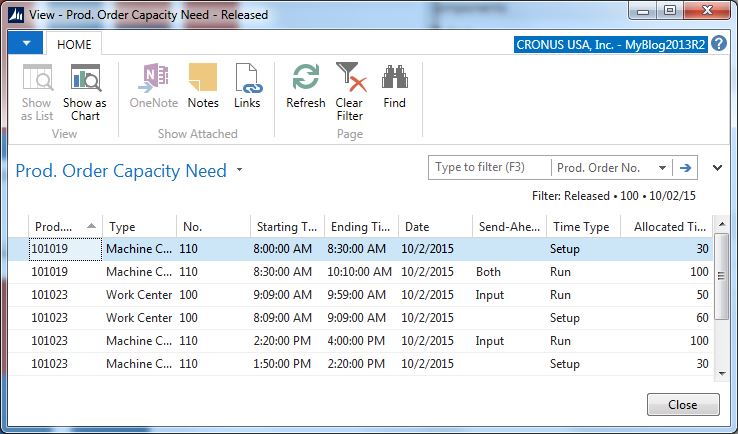
One nice thing about charts is that they provide an option to do drilldowns into the data; in this case the drilldown will show the production order capacity need page filtered on the work centers and the day that is being drilled into.
This is how you can create a custom chart in Dynamics NAV using the business chart control add-in:
Create the Page for the Chart
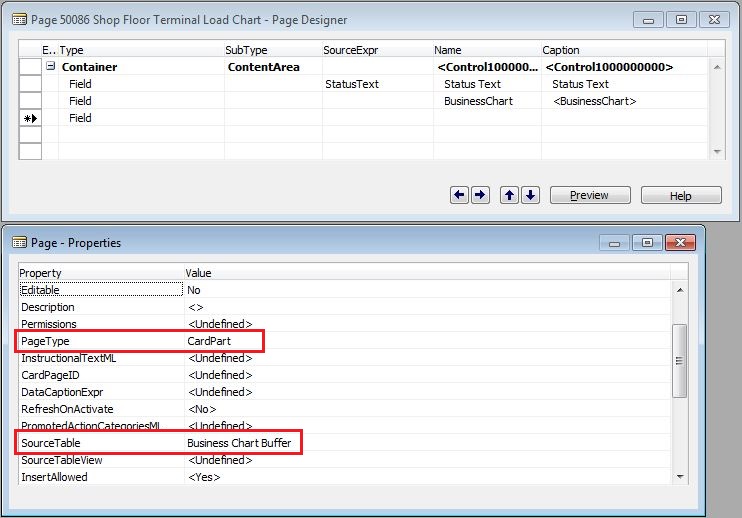
First we need to create the page where the chart is going to be displayed. We create a CardPart page based on the business chart buffer table, in this case I named it Shop Floor Terminal Load Chart (long and nice 🙂 ).
The business chart buffer table is a predefined table that Microsoft has made available to simplify the process of creating new charts (kind of like the good old Excel buffer table).
From the Microsoft help: The purpose of the Business Chart Buffer table is to separate the chart data from the page. The Business Chart Buffer table temporarily holds the data for building a chart, such as the chart type, measures, and labels. The table uses Microsoft .NET Framework interoperability to reference types in the System.Data assembly for building a data table that contains the chart data. To generate a chart, the page that contains the Business Chart control add-in retrieves data from the Business Chart Buffer table and passes the data to the Business Data Chart control add-in.
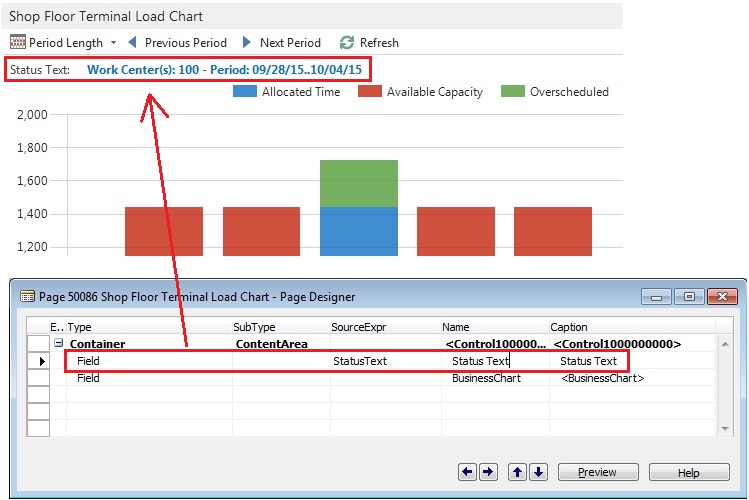
On the new page we place two fields, one called Status Text and one called BusinessChart. The status text will be to display the text above the chart and is a regular text field.
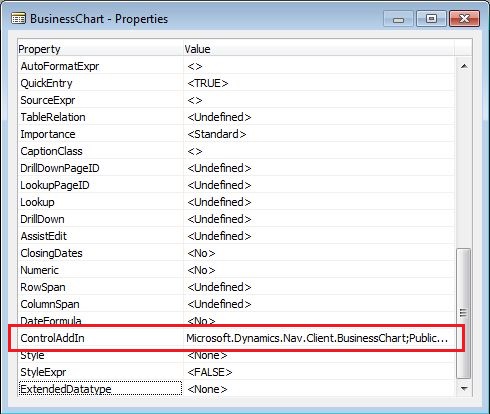
The BusinessChart is the chart itself, it has the chart add-in selected in the ControlAddIn property of the field.
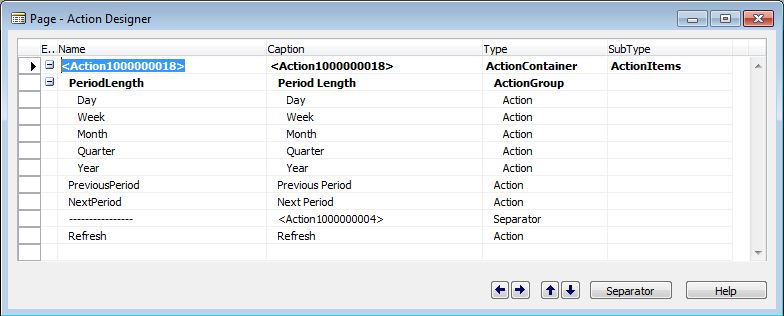
We also add some page actions to our page, those will be available in the top part of the page for the user to toggle through and change the period being displayed.
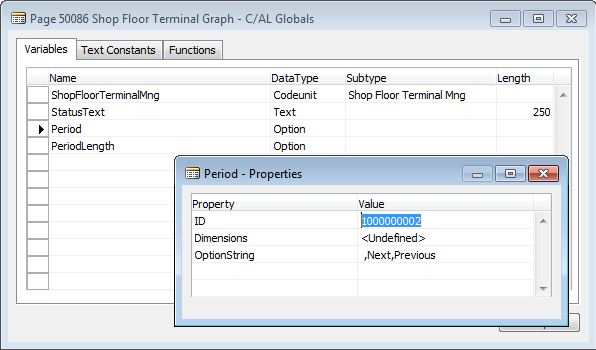
Next we need to put some code on the page. We start with adding some global variables according to below.
The Shop Floor Terminal Mng codeunit is where we are going to place our code to generate the chart (e.g. calculate the values and insert data into the business chart buffer table).
After this we create an UpdateChart function that will be called when the page first opens and when any of the page actions are selected. The function has three lines, one to update the data in the business chart buffer table, one to update the chart (which is a predefined function in the business chart buffer table) and one to get the status text.
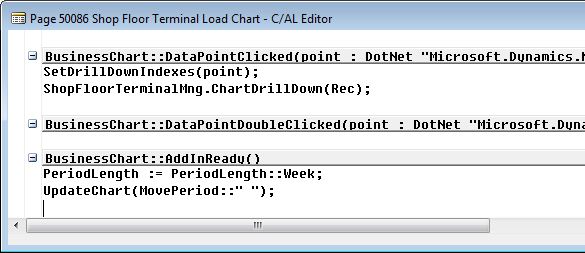
We also put code in the AddInReady function so that the data gets generated when the page is opened. Note that we can here set some default values of what to display when the page is first opened, in my case I say that a weekly view will be the one to first show.
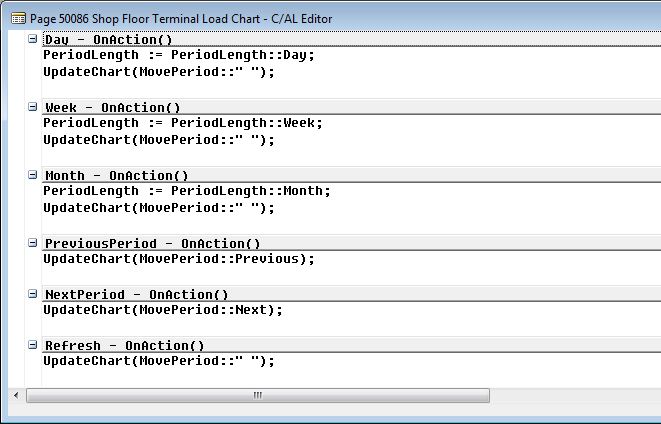
For the action items, we add the following code (also calling the UpdateChart function):
Create the Code to Populate the Business Chart Buffer Table
Now we have our page with the relevant properties, page actions, fields and code. What we do now is to write the code to populate the business chart buffer table with values to be displayed.
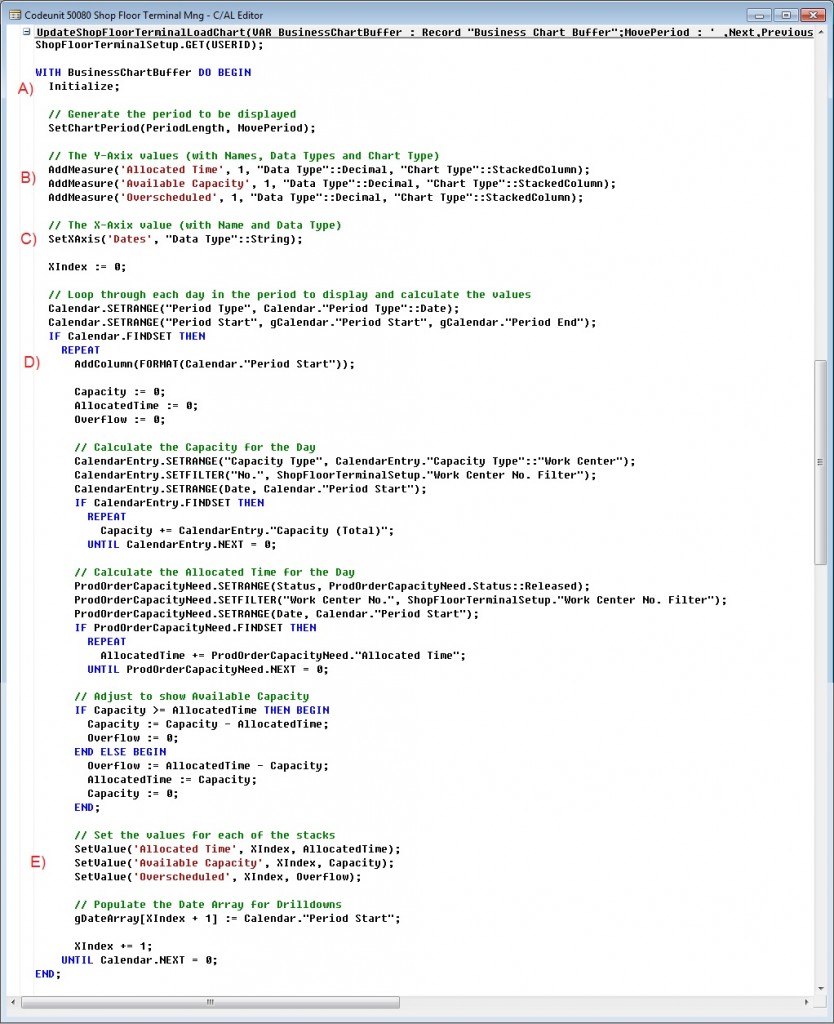
The main parts in doing this are outlined in the screenshot below. Where:
A) Initiates the table.
B) Is used to create the different measurements to be displayed as well as setting the type of the chart. In this case we use the StackedColumn to have Dynamics NAV stack the values on top of each other.
C) Sets the values to be displayed on the x-axis.
D) Adds a column (this is within a loop that loops through the days within the period, one column per day).
E) Adds the values to the columns. The names here should match the once in B). The variable XIndex (could be called what you want) should start with 0 for the first column and then increment with 1 for each column.
All of the above are predefined functions in the business chart buffer table. Nice!
The rest of the code is just to calculate the values to be displayed, which I am not going to describe and it will obviously change based on what is being displayed.
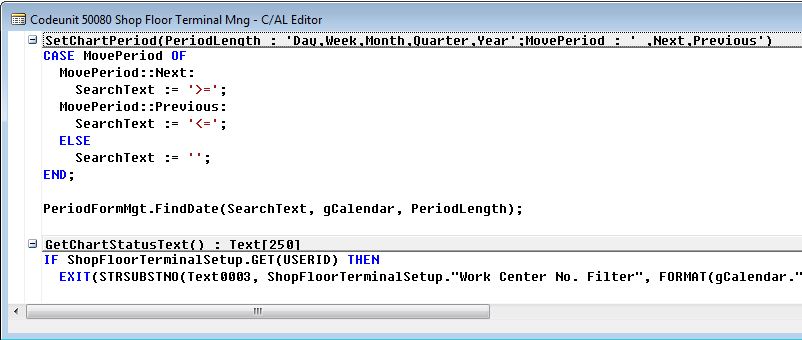
The SetChartPeriod function that is called above looks like below, it is the function that creates the start and end date. It uses the standard period format codeunit to find the right period, nothing strange.
Add the Drill Downs
Now we basically have what we need to run the chart. What is missing is if we want to allow drilldowns on the chart (which is optional). To do this we need to go back to the page with the chart and add a function call in the DataPointClicked function.
The SetDrillDownIndexes function will set the values of some fields in the business chart buffer table (Drill-Down Measure Index, Drill-Down X Index and Drill-Down Y Value) to correspond to what is being clicked by the user.
The custom function called is then applying a filter on the records and runs the page to be displayed for the drilldown. The key thing here is to know that the Drill-Down X Index field contains the column number that the user clicked on (0 for the first column, 1 for the second column, etc.), so to apply the filter correctly I stored the dates for each of the columns in a global date array variable when the chart was created then the array is used as a filter on the date (gDateArray[1] is the date for the first column, ect.).
Time to Test It
We should now be done and everything should work as expected. 🙂 If it is, running the page should display a chart. Hovering the cursor over a stack should display the value and the date.
Clicking on a stack should open a page to show the records (in this case the Production Order Capacity Need records for that day and work center(s)).
Add the page to a role center and you also see the page actions that allows the user to change the period displayed.
Simple, isn’t it! Well, maybe not the first time 🙂 , but once you have done one doing another one should be easy.
As with the other things I blogged about related to the shop floor terminal role center, if it makes it passed the R&D stage I will make the entire role center available in the downloads section then you will be able to download, test and evaluate the code described above.
Currently the shop floor terminal role center looks like below, so it is getting close to be finished. 🙂



7 Comments
Leave your reply.