Custom Progress Bar in Dynamics NAV 2013 R2
Here is an example of how you can create a customized progress bar in Microsoft Dynamics NAV 2013 R2. It uses the System.Drawing.Graphics .net method to draw a progress bar and display it to the user in a BLOB field. This method can basically be used to generate any type of graphic and display it in Dynamics NAV, which is very useful.
The scenario in the below example uses a work center task list that displays all operations for a specific work center. The task list should include a progress bar showing the statuses for all the operations of the production order. The status bar will be used by the machine operator to get an indication on if the earlier operations has started or not in his task list.
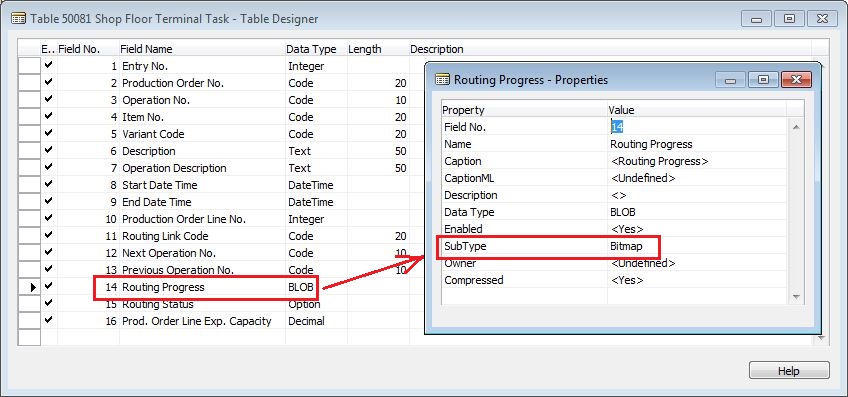
We start with creating a BLOB field in the table where we want to generate the progress bar. In this case it is in an custom table called Shop Floor Terminal Task, and the field for the progress bar I call Routing Progress. The SubType for the BLOB field is set to Bitmap.
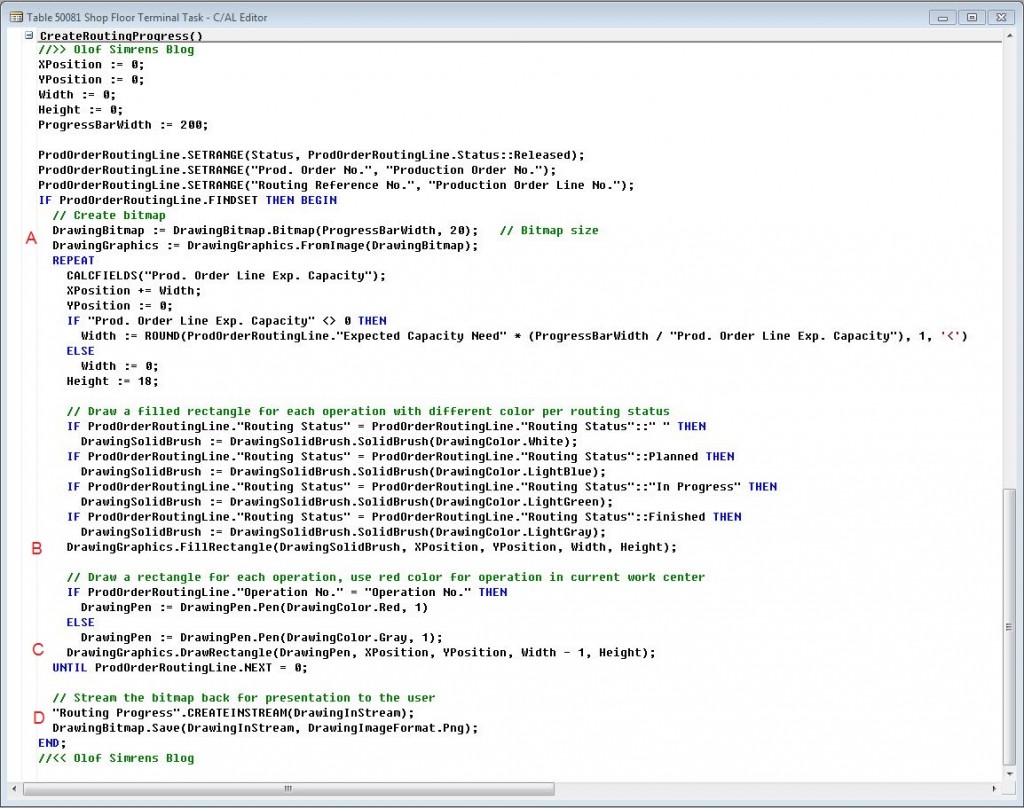
Next we create a function (in the same table) that will generate the progress bar and stream it into the BLOB field, in my case I call the function CreateRoutingProgress. In the function we add code to loop through the production order routing lines and build the progress bar with the following:
A. We first create a bitmap. The size of the bitmap can vary, but I think something like 200 wide and 20 high works good for a progress bar to be displayed in a list page.
B. Inside the loop we then draw a filled rectangle for each operation. We set the different colors according to the routing status. And the width of the rectangle varies based on the expected capacity need for the operation, this way long operations will get a wider rectangle.
C. In addition to the filled rectangle we also draw a regular rectangle. This will be drawn on top of the solid rectangle since it is place afterwards in the code. We make the rectangle for the operation that matches the operation in the task list red.
D. After we have looped through all the production order routing lines we stream the bitmap back into the BLOB field.
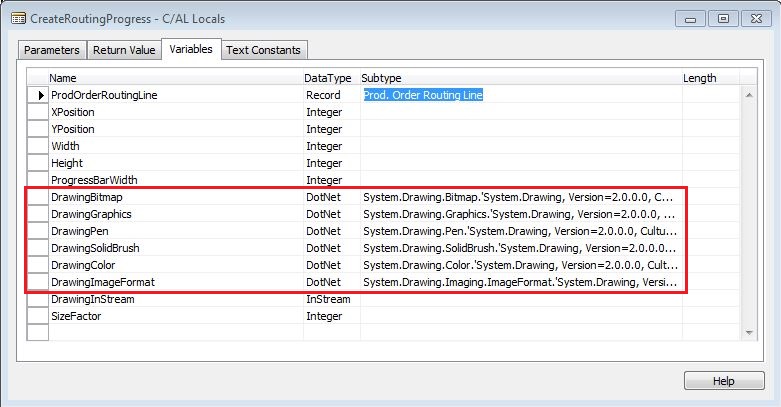
The variables used are DotNet variables according to below (they are also in the sample download if you want to copy/paste them into your own application).
Now we have a BLOB field to store the progress bar and a function to generate it. We then call the CreateRoutingProgress function when the records are inserted (in this case I use a temporary table where records are inserted when the user runs the page).
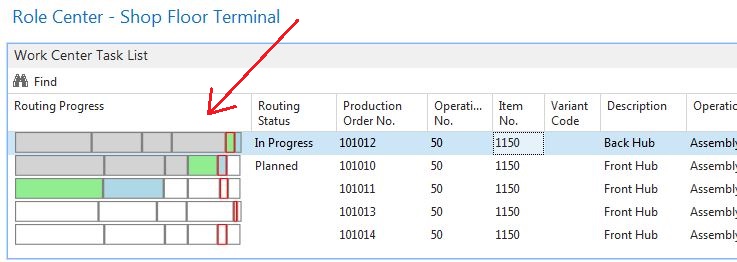
Time to test it! We run the page to see the result. The progress bars consists of parts that are different lengths based on the expected capacity need and each part has a color depending on the status of the operation. The part that has red edges represents the operation to be performed at the current work center. The operator can now easily see if the production order has been started and where in the process it is and can start preparing for upcoming jobs. Grey represent a finished operation, green represent an operation in progress, blue represent an operation that is planned, and white are operations where the routing status has not yet been changed. Nice! 🙂
Conclusion
Creating simple graphical parts that represents different values or set of values to make things more visible in Dynamics NAV is very useful. Using DotNet variables like this to do it is actually quite easy once you got the first one to work.
The above is part of a Shop Floor Terminal role center that I am building for my own education. If it passes the ‘R&D stage’ then I will make it available in my downloads page. It will be world class or I will not publish it! 🙂
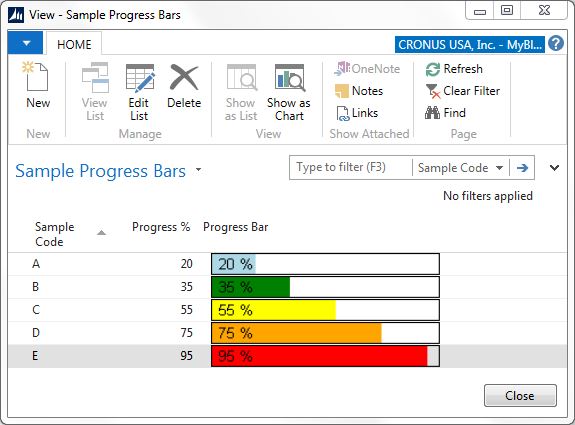
In the meantime I have added some sample objects (a table and a page) in the downloads page if you want to download and have a look at the code. The sample generates more basic progress bars that looks like below.
Cool with colors! 🙂

6 Comments
Leave your reply.